I recently came across a video of tape measures "racing" along a board of wood as they retract. Who doesn't love extending the tape as far as you can and recklessly letting it fly in? It obviously accelerates dramatically. Like any physics-minded person I got to wondering if the force is constant. How might we assess?
I'm home for the summer, a summer I desperately needed, and away from some of my usual tools. No probeware. No students to help. First I put a small bucket with a handle on a food scale from our kitchen. I extended the tape measure and used it to pull up on the scale. The force was somewhat constant, but not as steady as I would like. A force probe would have been handy to average many data points and see the force graphically.
Perhaps it would be simpler to measure acceleration, rather than measuring force directly. We could replicate the original video. But what about friction? I've also noticed that tape measures sometimes stick when used in this position. What if we pulled a cart of known mass and analyzed the video? The toy cars at my disposal were all too light—or had too much friction—to provide a motion that was slow enough and consistent enough to satisfyingly measure with the tools on hand.
But there it was staring me in the face: the air hockey table. I put the tape measure on its side, so that the weight of the extended tape doesn't cause it to rub as much against the tape (tape retracts more smoothly). Lego base plate floats beautifully on table. A few Lego bricks are placed on one end of the plate to hold the hook of the tape measure during retraction.
Here is the second qualitative electrostatics lab redesigned and video clip enhanced for use in Distance Learning. The first was "A Pithy Matter" shown in a separate post.
For "Electroscopia," we swap out the pith balls for a can-form electroscope. These were sold with cardboard inserts with angle markings to make them more electrometer-ish. In practice, removing the insert allowed students working on opposite sides of the electroscope to see the pointer without obstruction.
The activity works through a series of observations involving charge typing, induction, and the differences between conductors and insulators. It closes with some questions students should be able to answer with the benefit of evidence.
There are appearances of the Fun Fly Stick, a latex balloon, and my head in this activity. Not to be missed!
In practice, students "ask for help" to summon the instructor to their breakout room. Once there, students request an Object or a Charge and identify their room number. The instructor shares their screen while showing the appropriate clip, then leaves the breakout room as students interpret the observations.
Sure, there's some kind of force involved in the rubbed plastic/pith ball interactions. But do we really need to consider it a whole new force? Isn't it just some form of gravity or magnetism? Let's experiment.
This qualitative exploration of electrostatics features: electrostatic attraction and repulsion, a triboelectric sequence (but we don't use the T-word here), an electrophorus (with pronunciation guidance), and two rounds of Pith Ball Ping Pong. What's not to like?
Let me just add that nothing—nothing—turned my most jaded, been-there-done-that high school seniors into elementary students more than this activity. When the pith balls started flying, their giddy glee was an involuntary reaction that expressed itself before they could so much as attempt to stifle it.
A Pithy Matter - Observations (HTML export as linked within the GoogleDocs document). This is a sequence of video clips showing interactions between cloth-rubbed plastic and pith balls, with special appearances by an electrophorus (ft. slow-motion electrophorus ping). Here's the movie export of the observations for use on devices that struggle with the HTML export—link also included in gdoc).
A Pithy Matter - Special Observations (HTML export for use by the instructor). They will seem silly to experts with content knowledge, but they are actually critical for the purpose of this activity.
This activity was designed for use with video conferencing (e.g., Zoom). Students need to check in with the instructor to see the "Special Observations". It's a redesign of what was an in-class lab. I consider it a mark of success that I am able to use the same lab quiz (ported to Socrative for online use, of course) to assess student performance on the activity.
The roughest edge for students in this activity is recognizing that the brick is far and away the "most gravitational" object in the apparatus and how it can be used in this lab. The instructions make an attempt to steer, but still... Once they get past that, most groups catch on to the value of the bar magnet. Most; not all.
To the best of my knowledge, this activity is not duplicated or even simulated elsewhere in teh interwebz. No Pivots; no PhETs. I will be corrected in the comments if I am mistaken.
In Distance Learning, I'm everyone's lab partner in addition to being the instructor.
[RT;DL is remote teaching; distance learning. Where we show our attempts to bring extant lessons into the COVID-19 era.]
In the old days of face-to-face, in-class teaching, we did a station lab activity involving inertia experiences. It was called "Inertia in Action."
I retooled it into a video-based demo in which small groups could view segments, discuss prompts, and record their ideas on a Google Doc. It may not be your cuppa. But it works for me, given the circumstances.
I am sure everyone has a compelling narrative about how the COVID-19 pandemic upended their lives. This post is my story with an emphasis on how we responded at my company, PASCO scientific. One of our main responses was to create distance learning lab resources. They are described and linked to at the end of this post. Feel free to skip right to them.
At the end of February my wife and I found ourselves at the Kaanapali Beach Hotel in Maui. We have been going there annually for the last 6 years for what used to be my ski week break. We used to go every few years and take our daughter and son. After they were out of high school their schedules didn't permit it. I remember telling them about our plans to go to Maui when they were in college. They replied, "but we don't get that week off anymore". We said "we know" with big smiles on our faces. We had a great week for what would be our last trip for many months. On our last day we went to nearby historic Lahaina. We went on a whale watch trip and walked up and down Front street. We were joined by hundreds of cruise ship passengers who were shuttled into town on small boats. We learned a week later that the name of the ship was the Grand Princess and it had passengers and crew infected with COVID-19. This was the ship that was stranded in San Francisco Bay for weeks as they tried to decide what to do with them.
Humpback whale spouts with the Grand Princess in the background
On our return we heard about the first known case of COVID-19 in the United States that was not due to travel. We were concerned because it was in nearby Sacramento. It also was troubling because the victim was not even given a test when they first went to the hospital with COVID-19 symptoms. Still, this was just one case so we felt safe about our plans to attend the Harry Potter and the Cursed Child play at the Curran theater in San Francisco. Our daughter is a big Harry Potter fan and this play was our birthday gift to her. We never considered not attending the play even after we learned that the cruise ship stranded in the Bay was the same one from Lahaina. We met our daughter, her boyfriend and two of her friends at the theater and had a great day. They were not concerned about COVID-19 but it did occupy a lot of our conversation. The coughing woman behind us caused some anxiety but no panic. The play is so long it is split into two parts with a long break in between. We had a nice dinner during the break at the San Francisco landmark, John's Grill. Little did we know that this would be our last large public gathering for many months.
One last large public gathering before the lock down, March 8 2020
Things happened fast at PASCO the next week. On March 9 all of our travel was cancelled. This included a trip to Qatar to conduct training and to Boston for NSTA. I was most disappointed about missing the Red Sox vs White Sox game at Fenway on April 4. That would be the first on a long list of disappointments that seem trivial compared to the hardship and suffering that would be inflicted on millions of others. On 3/11 my group, Curriculum and Professional Development, met to discuss how to respond to the developing crisis. Since preparing for Qatar and NSTA was on hold, we had time to do something for teachers who were quickly transitioning to remote teaching. We came up with a plan to create a distance learning page on our website. On it would be links to videos we would produce that would show us explaining and performing many labs that are typically done in a second semester physics, chemistry and biology class. We would post the data files and student handouts so students could perform the analysis. We also would post the teacher guide with sample analysis. We increased the trial period of PASCO Capstone and SPARKvue analysis software to 180 days. That extension continues so teachers wanting to use video analysis should check out PASCO Capstone. Additionally, we gave free access to our online textbooks, Essential Physics and Essential Chemistry. Now all we had to do was produce 21 physics, chemistry, and biology lab videos before PASCO had to shut its doors! That happened sooner than we thought. Placer County issued a shelter in place order effective on Friday, March 20. We succeeded with our goal, making and posting 21 distance learning labs with videos. We went into lock down knowing we had created something useful for teachers that were struggling to teach science online. The distance learning page is still active but the free access to Essential Physics and Essential Chemistry has ended. Here are the 10 physics labs that we posted. Make sure you log into your PASCO account to be able to access the teacher guide and data files.
We remained away from the PASCO office for a lot longer than the original 4/10 specified in the Placer County shelter in place order. We were instructed not to work but were paid our full salary until March 28. After that we could use paid time off or file for unemployment. I did the latter and found the online system worked pretty well. I never thought I would file for unemployment but since I had paid my taxes all those years, I went ahead and did it. My wife and I were thankful every day that we had recently moved from the Bay Area to a house on a lake near Auburn, California. The lake is like having a 240 acre back yard. I did a lot while in lock down, some of it even useful. Among my pandemic projects were a set of labs and videos experimenting with a chain on a pulley and a chain hitting the ground. I later used this work to create a talk for the virtual AAPT summer meeting.
The view from our deck as mist rises from Lake of the Pines at sunrise
We remained in lock down until 5/4. At that point my group and a few other key personnel were allowed back into the office. I felt safe since there were few people there and we were spaced very far apart. We were scheduled to work a 4-day 32-hour week so no more unemployment. I was able to work at home but when you develop physics curriculum you need a lot of stuff and I missed my stuff! Over the next couple of weeks more people started coming in to the office with everyone back by 5/18. We also went back to a 40 hour week. Everyone wears a mask when away from their cubicle and meetings are on Zoom. Some employees are starting to work part-time at home to reduce the density at the office too. I still feel safe there.
I had a lot of things to work on but one was a collection of labs for two new products, the Physics Starter Lab Station and the Physics Extension Lab Station. These are bundled wireless sensors that come with a lab booklet, 10 labs for each station. There are chemistry lab stations , biology lab stations, elementary lab stations, middle school lab stations, and agricultural science lab stations too but I am going to focus on physics. We also committed to make a video for each of the labs in the Physics Starter Lab Station. This was an opportunity to make more distance learning labs. Originally we had wanted to make some for first semester topics but the lock down prevented that. Over the last couple of months I finished creating the labs and we made videos and posted data files for the labs listed below:
We plan to make more of these but they are on hold because of our new project called PASCO Academy. It was inspired by the popularity of the distance learning videos but motivated by the need to create something that will bring in revenue. Schools, teachers, and home schoolers that subscribe to PASCO Academy will get access to 15 weeks of a lab video program, access to our online textbooks, and unlimited license to SPARKvue software. The lab program will consist of a teacher preparation video, a lab overview and data collection video for students, and a follow up analysis and discussion video for students. The labs will all come from the Essential Physics or Essential Chemistry online textbooks that are targeted at a regular to honors level class. My colleague JJ Plank and I are in charge of the physics PASCO Academy. If you found the distance learning video labs useful I suggest you check it out.
Like many, I've been trying to get a handle on potential distance learning tools over Summer Nocation. It seems there is a vast library of resources and web tools for instruction in general and physics instruction.
I use PhET already. I'm working with my district to gain access to Pivot Interactives. My district's LMS is Google Classroom, while our SIS is Q (Aequitas).
I have never used Flipgrid, Padlet (or Wakelet), EdPuzzle, Quizizz, Socrative, Screencastify or Screencast-o-matic, Loom, Zoom, Peardeck, Jamboard, Desmos, Edulastic, Flippity, or any other must-have tool that is explained in a video that features a noodling xylophone over a strummed ukulele while a narrator announces, "This ... is <ProductName>. The tool that lets you <do the thing you didn't even know was critical to your instruction program, but is—especially now in distance learning>". If a personal favorite of yours is in that list, you may be tempted to cast me as a luddite.
There is no shortage of webinars of experts who have been using these tools for years, where importance of Bitmoji is made unambiguous, as is the value of carefully curating of your virtual Zoom background.
At the virtual AAPT Summer Meeting 2020, the phone app, Phyphox, caught my eye (thanks to Susan Johnston's presentation). Like Google's Science Journal app, it leverages a phone's many sensors.
In addition to the activities available from Phyphox, Lawrence Livermore National Laboratory has prepared a series of physics distance learning lessons. I already had the app on my phone, but I was compelled to open it and play around on my own.
As with so many things in the realm of Distance Learning, there is a question as to whether it's appropriate to assume our students have access to a smartphone.
I'm not going to be able to construct a new and better version of the curriculum I've been honing for over 30 years in the snap of a finger. Or at all. If things work out, we'll be back to face-to-face instruction by ... 2022 is my prognostication. Maybe even Fall, 2021. For now, we're going to do our best with the situation we're in.
After completing the "Torque Feeler" / "It's All in the Wrist" Conceptual Physics Lab Manual activity, we add the Torque-Master Challenge.
We again repurpose our five-foot aluminum tube from the Pasco Scientific Lenz's Law Demonstration set. Sometimes we use it as a blow gun. Sometimes we use it for examples of resonance. This time, we tie an ordinary 500-mL water bottle to the end. Challengers must hold the arrangement level for ten seconds.
Over the years, I have found that very few of my students can do this. I can, and I am not young, cut, ripped, or chiseled. And I do not lift. I mean, look at me in the video. Honestly!
Why I can do this while so few of my students can is a mystery I have no answer to. Now that I think of it, though, very few of them can match my speed when we use this tube as a blow gun. I have no explanation.
When we find students cannot match my blow gun speed, I admonish all of them to quit smoking!
Throughout the year I mentally categorized everything as either pre- or post-AP. When I finally made it to the promised land of post-AP testing I then encountered a new challenge, keeping students engaged for a few weeks when they want to do absolutely nothing. I had many options, even putting a poll to them just for information (reserving the right to completely disregard their #1 choice of "do nothing"). I could talk about topics not covered in AP C like waves or optics or thermo or relativity? We could do a research project or have some kind of demo build? They could present a talk? Some ideas seemed better than others but the timing wouldn't work.
I finally settled on doing a series of group competitions, something different each day, something hands on and fun. I found lots of ideas online, some from labs I didn't get to do, but did struggle to find ones that were Electricity & Magnetism (second semester) focused instead of Mechanics (first semester) focused. I was hoping that the competitions could be on the same topics they would later be tested on for their end-of-semester final. Unlike most AP classes, I opted not to give students a final prior to the AP test. The argument is usually that students need the practice of an AP-like exam prior to the test; so we completed mock AP exams for practice but not for a grade. My students may take up to six AP classes in their junior or senior year so they have several weeks of high stakes testing (class finals) before more high stakes testing (AP exams). I decided that the practice and their mental health was more important than their grades at that point in time and they could take the final exam during finals week.
Since I was building the competition up from scratch there was a lot of writing, re-writing, last minute tweaking and of course post notes for next time. In the end it was a workable model with no major issues but as is often the case with the first time through, it wasn't quite right. In either case now I have examples and procedures for a series of activities to either use in the same way next year or throughout the year.
Day 1: Explanation and Bridge Building
On the first day I explained to them that they would be arranged into groups and competing each day for the rest of the school year. Each group was assigned a Greek letter and asked to come up with a clever name using the letter. I tried to split Chi, Psi, Pi, etc. from being in the same class and removed Alpha to save as my example of "The Alpha Academics." As expected, my students were way more clever than I and came up with some great names: Gamma's Cookies Oof (Omicron upper and lower case) Beta Testers Mooupsilon Kappa-citor An Iota of Understanding
I introduced the format of the competition using this powerpoint. It had the rules, grading specifics and the explanation for each day's competition, which was never revealed ahead of time. I explained to students that coming up with the name for our little competition was hard, I almost decided on the Phunger Games (like the Hunger Games series) but just couldn't. It came down to the morning of when brilliance struck and I decided to name it the PhysX-Games, complete with logo based on the popular X-Games:
Students were of course very concerned about how their grades would be affected by the competition. I did not wanted to punish them if their group didn't win every day but I wanted everyone to put effort in. I also wanted them to be rewarded for working well as a team and accomplishing tasks. I opted for a system that separated individual effort from group effort. Each day that students were present they could earn 5 points for actively participating. Each group would earn points for the day for accomplishing the task but they would earn more points for being the best at it. Good participation on an individual level required helping their group for the whole period. Sleeping, doing other homework or being caught with a cell phone meant zero points for the day. These participation points went into students' lab category so it was a welcome bump for most. If a student was caught with a cell phone that day their group could not win the competition, but it did not negatively affect the other group members' individual points. I would keep a running tally of each group throughout the competition so we could always see who was in the lead.
But why care if you are "winning"? The prize had been another sticking point initially. What do I offer students who are only a few weeks from graduating, that are mentally "done" after AP testing? I hadn't offered extra credit all year so it seemed like a good reward. Specifically I decided to add enough extra credit to their individual final exam grade so as to boost their semester grade by 1%. Yet with three classes of AP Physics C I had to find a way to limit my first few periods from giving the last class the "answer" to the challenges each day. I needed a way to keep groups between classes competitive. So I upped the reward. The group with the most points in each class would get points added to their final exam to raise their grade 1% but the group with the most points across all three classes would get 2% added to their grade. This was met with hoots and hollers in my classes. I need not worry about answers being shared between classes, they were in it for a grade bump and the competition was fierce.
After the explanation and group naming we didn't have time for a long competition on the first day. Instead we started with something basic, balancing uniform sticks over a table edge. Groups were given five uniform paint stirrers and five uniform meter sticks. They were given instructions which included the rubric I would be grading them on. Without attaching the sticks in anyway to the table or counter-weighting them students were to extend each group of five out as far past the table edge as possible. Points were awarded for balancing the sticks and a bonus was given to the group with the farthest reach for paint sticks and another for the farthest reach for meter sticks. I did find that my naming it a Cantilever bridge was a bit of a misnomer; the activity is similar to the Take It From The Top activity from the Exploratorium.
Initially students tried to use some of the meter sticks as their own counterweight so we had to specify that the farthest extended meter stick had to be the top one. Students were to calculate the hypothetical Center of Mass of the system based on their measurements and assume no thickness to the sticks. The record for paint sticks was 41.4 cm and the record for meter sticks was 120 cm off the table. Groups would go back and forth, adding millimeters at a time as the record was erased and rewritten on my front board. It was a tense day in Physics!
Day 2:Mass & Spring
To review oscillations and simple harmonic motion (SHM) I adopted a lab practical challenge I had read about but unfortunately can't remember where. Students were challenged to hang the correct mass from a spring so that it's period was as close to 1 second as possible. Again their instructions included the rubric so they knew how to earn points. Students are given no other information however, and have to first determine what they need to know about the spring in order to find the needed mass. Once calculated, students would hang the mass and spring from a Vernier Dual Range Force Sensor and start it oscillating. They would use the software to determine the period for five cycles then divide by 5 to find the period for one cycle. Each class was assigned a different target, 0.5 s or 1 s or 1.5 s. I had used stiff, old springs that students had not worked with before so that they had unknown larger spring constants. This meant that the 1.5 s period required a large mass and so I changed it to 0.75 s for that class. Students used the Vernier probes to calculate the spring constant as well and so everyone got very accurate results as seen at below.
The second stage of the competition was to determine the mass of an unlabeled or hidden mass using the same procedure but in reverse. I used several old masses found in the back of my cabinet that had had their labels worn away over the years. I also made unknown masses out of toilet paper tubes and dead batteries. Each mass was measured and recorded so that I could see how close each group came. If they calculated the unknown mass to be within 10% of the actual they received group points. The group closest to the actual mass received bonus points; bonus points were also awarded for the group that got closest to the assigned period.
In the future I think I will decrease their accuracy by only providing a spring scale for the initial determination of the spring constant. This will make it harder for groups to get so close to the assigned period and award groups that employ careful lab techniques. I would still use the Vernier probe to determine the period of the oscillating mass.
Day 3: Flying Cups
Since our competition started during the second week of AP testing there were still students that were occasionally gone to take AP Exams. On those days they did not earn their individual points for participating in the PhysX games but they were also not penalized for missing them, it was excused. If they were *cough cough* "sick" that day however, they would have to complete a make-up activity. If the equipment could be easily gotten at home they could do it there but some competitions required sample data for their alternates because students did not have the equipment at home.
The Flying Cups competition however, could easily be done at home. I saw this for the first time at an elementary school Science Night and immediately decided to do it in my classroom. This video (also below) explains the how to's and the teacher flies several different models. Essentially two identical cups (made of paper or thin plastic) are taped together at the bottom. A chain of four or more rubber bands is made and wrapped around the center of the cups and held on one end. When the cup is released and the rubber band chain pulled the cup is launched forward.
Each period, 30+ AP students were completely engrossed in flying these cups. They tried all kinds of models, trying to figure out if paper or plastic worked better, a longer rubber band chain or shorter, more rubber bands or fewer, added mass at the center or the edges, etc. In the end a few smart students realized that launching from on top of a picnic bench gave them a distance advantage. Soon everyone caught on and eventually the whole class launched from a small hill in the center of our school. Some students were better launchers than others, one of the more successful being a varsity baseball pitcher. Groups earned points for each meter their cup traveled before striking the ground (not rolling) and had a bonus for the farthest in each class. By the end of the day the record was 14.7 m, with most groups over 9 meters. It was a simple activity, definitely mechanics but very fun.
Day 4: Leyden Jar
This was an activity that I used to do for years in my regular Physics and even Conceptual Physics classes. I taught students about parallel plate capacitors by having them build a simple Leyden Jar out of a film canister. I still hoard film cans to this day even though I haven't had time in the curriculum to do this for years. For the competition students were instructed to use a small film can, or a jar if they brought their own, to make a simple capacitor. This old video of mine shows the basic construction:
I had asked students to bring in cups for the flying cups activity and jars for the Leyden Jar activity without telling them what it would be for (so they didn't research it in advance). A larger jar would increase the capacitance their jar could hold, something they realized too late. Students were challenged to build a Leyden Jar that would hold a charge and then asked to hypothetically calculate what the capacitance should be using the cylindrical parallel plate equation they found in their textbook. After their calculation we charged up their Leyden Jars with my Whimhurst machine and measured the capacitance using my new capacitance meters.
I found that you have to be careful to stop charging the jar before it discharges itself, something that happened quickly for sloppily made jars. I used alligator leads to connect the Whimhurst machine (with discharge electrodes far apart) to the inner and outer surface of the jar being tested. At least one of the leads had to be removed for testing or you would measure the capacitance between the much larger Leyden Jars of the Whimhurst machine.
Students got HUGE errors between their theoretical and measured capacitance, as in the hundreds ofpercent. I need to improve the testing system if I ever want points to be awarded based on their error. Students had to research the dielectric constant of their jar, be it plastic or glass, and there is a lot of variety in that value depending on the actual material. Also without a pair of calipers students had to try to estimate the thickness of their jars as best they could. One creative group asked to borrow box cutters to cut off the thicker lip around their film can so that they could more accurately determine the thickness. Generally the smaller film cans had a higher percent error and a smaller capacitance. The large jars brought from home tended to be more accurate and their larger surface area gave them a larger capacitance. My students were able to produce capacitors from 10 (film cans) to 100 (glass mason jars) picofarads.
While I liked the review of capacitance, specifically what it was and what physical attributes of the capacitor affects its capacitance, the build was pretty easy. There wasn't too much difference between the capacitance of a well made or sloppily-made jar from the same film can. One student made a simple flat capacitor about 4x6" just for fun and it had a capacitance several orders of magnitude larger. Another variation may be to assign a certain dielectric material, plastic or paper or cardboard, etc. and a certain capacitance. Students would have to determine the size of the parallel plate capacitor for that particular thickness of that particular dielectric to achieve that particular capacitance. I feel like it would be more accurate, easier to test and I could judge them based on their accuracy to their hypothetical.
Day 5: Mystery Circuit
This was a variation on my Electric Building (House) Project for regular Physics and Conceptual Physics. I gave each group a shoebox that had a lid with their instructions and made paperclips, brads, wire cutters, wire strippers and holiday lights available. Unlike the previous project students got to design whatever circuit they want as long as it met the conditions:
1. Uses only one 9 V battery.
2. Has at least 8 lights.
3. Has at least 2 switches.
4. All lights can be lit up, all lights have to be able to be turned off (for storage).
Groups were to design their circuits, build it so that just the lights were visible on the outside of the box (rest of wiring hidden on the inside) and make a matching circuit schematic. That earned them the minimum points for accomplishing the task. When they were done each group were to exchange their mystery circuit box with another group and try to guess the schematic. Each group that they successfully stumped earned their a bonus point. I told them that it was quite possible that each group would be stumped and earn points after the exchange.
We did have a few hiccups on this one that I was not anticipating. In my first class of the day we found one LED strand of lights that was masquerading as an incandescent one. Since LEDs are directional it was very difficult for students to build a working circuit with them. And since relative brightness of bulbs is usually how students guess how bulbs are connected the equally bright LEDs wouldn't work for this task. Some of these groups got pretty far into their build before the mistake was recognized and ratified. I had also expected that since students had built a simpler circuit in the same way last year in regular physics they would be able to build this more complicated one quickly. I was wrong. We ended up taking two days to complete this and some groups never did.
There were a few groups that made their circuits so complicated that even they weren't sure how it worked, or the load was too high and it never did. Hurried and/or loose connections made it difficult to judge if their circuits matched their diagrams. Some made simple light connections but used the switches to complicate it, which was more of what I was hoping for, like below:
In the future I think I will limit the number of lights, switches and perhaps more strongly emphasize that all lights must light (not that "Technically a microamp could be flowing through it even though it looks off"). I will have to give them more instructions on how to make the switches, strip wires, etc. I expected students remembered those skills from the previous year; which assumes they did actually build the project they turned in. In the end the activity worked but I wasn't really satisfied with the quality of the project or their efforts.
I had also hoped to keep this year's projects (hence the requirement that they had to be completely turned off) so that perhaps the next year I just asked groups to map the mystery circuits made this year. So few were working a week later when I went to dismantle them that I had to abandon this idea and instead scavenged them for parts. Side note: I take apart all but the very best Electric House projects each year to save the parts (brads, paperclips, bulbs, 9Vs, motors) for the next year.
Day 6:Defibrillator
I got this idea from Frank Nochese on Twitter about challenging students to build a defibrillator model like an RC circuit. I researched defibrillators and put a call into my sister who is a registered nurse to get the low down on how they were actually used and how that related to the circuits my AP students had used. Turns out that the typical movie scene is completely wrong (and a pet peeve of medical professionals everywhere). Usually a patient is shown flat lining (no more heart beat) and it is then that a defibrillator is applied and the doctor charges it up and shouts "Clear!" and a big thwump is heard as the person/ body jumps up on the table. This is repeated until a heart beat is restored. In reality the defibrillator can only be used when there is still a heart beat but it is irregular. A loss of a heart beat means that chest compressions must be applied in order to restart the heart and get it beating again.
When I researched how they actually worked I found that the first prototypes used AC current and modern ones used inductors. I didn't have any inductors so I opted to still use Frank's original plan using an RC (resistor-capacitor) circuit. Real defibrillators use inductors so that the current oscillates, the oscillation can be controlled to match the desired heart beat. An RC circuit model would simulate one "beat" if you will because it would only charge and discharge once. My research led to a few additional questions about defibrillators and the more physics related concepts that I've added to the bottom of the instructions page.
Groups were told that they could use whatever resistors and capacitors they wanted to meet the requirement to save their "patient." I made little paper hospital gowns to go around the "patient" resistor so that students wouldn't get confused when they had multiple resistors in the circuit. It needed a little paper cot as well. These just might turn into fabric ones by next year ...
Each class was assigned a specific "patient" resistance, the maximum current that could go through it and a maximum charge on the capacitor. Groups had to first figure out what their circuit might look like then use those maximum values to determine the specific size capacitor and total resistance to use. I had 100 or 2200 microfarad or 1 farad capacitors for groups to choose from. Almost everyone ended up using the 2200 microfarad. I had a shoebox, literally, of organized resistors for students to work through. They were not as organized when we were done. Some groups couldn't find exactly the value of total resistance they needed but found getting within a few ohms was fine. A few groups wanted to stick to only one resistor (or mistakenly thought that the "patient" resistor was the only one allowed in the circuit) and therefore tried to add a few capacitors in series or parallel.
Once students had built a circuit that allowed them to charge their capacitor (not through their patient) and discharge it through the patient they attached meters. We could probably have done it with multimeters as Frank did initially but I opted for our Vernier voltage and current probes since we had them. Since the currents were in the milliamp range the graphs are so small. Most groups got a good decay curve for the current through the "patient." I had wanted students to also measure the voltage across the capacitor and the resistor but often this was not done due to time.
Next time I won't have all my resistors out. I shudder to think of the order of the envelopes of resistors in that box when I go to look again. I would still have a variety but will try to pair down their options. I did not assign the additional context questions (below) that I wrote this time, they were my backup in case it didn't work at all. Next time I would definitely include them as I like them and think they bring some background to the activity. Other than that I think it was a great lab practical for RC circuits that Frank came up with and I will definitely use it in the future. This is one that I would like to add to my regular curriculum, if we have time.
Day 7: Trivia
This was the Tuesday after Memorial Day weekend, the last real class day before finals. I thought the last day of competition would be a good day to review the material for their final. Rather than using a Jeopardy type format, in which can be slow and often leads to one group keeping control of the game, I opted for a pub trivia format. If you aren't aware a lot of pubs or breweries have Trivia Nights that include teams that come back each week and multi-month tallies of points. Rather than having groups shout out answers or use a buzzer groups submit their answers to questions in writing. Everyone who gets the answer right can get the point, the question move along quickly and you can maintain a bit more decorum. I wrote up over 60 questions spanning the whole Electricity & Magnetism semester, some were multiple choice, some shorter response and some calculations. Each question had a timer for either one minute (conceptual) or two minutes (calculations & short responses) on the slide itself.
Before we began I went over the rules with each class:
•All
groups will be asked the same questions and record their answers on a sheet of
paper to be turned in and graded later.
•NO
CELL PHONES OR OTHER ELECTRONIC DEVICES, TEXTBOOKS OR NOTES ALLOWED. These are
questions to be answered by your brains alone.
•Do
not shout out answers. Do not talk to other groups. Whisper with your group.
•Groups
earn points for each right answer. The group with the most points will earn an
extra 5 points.
•Each
question has a time limit before the next one is shown but you can write
answers to previous questions if you have extra time on another question.
•You
can have more than one paper and pencil out but must turn in one answer sheet.
Groups used whiteboards for their work or discussion/ debate drawings but kept all their "final answers" on a separate piece of paper I would collect at the end. I was able to sit down and read each question as it came up, the counter ticked by and then moved the slide forward for the next one. Students kept on task and most groups attempted all questions. Sometimes there was a lull as they answered a question in less time than was given but sometimes they ran out of time. I encouraged them to record information for questions they ran out of time for so that they could go back on questions that they had extra time for. In the end I collected all the papers and graded them, awarding a point for each right answer. Since there was only one per group it did not take long and sometimes I offered partial credit. The group with the most questions correct also got the bonus points.
What was difficult was the mixing of the questions. We weren't going to get through all 60+ questions in each class so I tried to skip around so that they got a sampling from each major unit (electrostatics, current electricity, magnetism, etc.). This confused some of them as they had to number their answers with the question number which may not have been the number following the last one. There were some questions I wanted every class to get and I found myself having to record on a scratch piece of paper which classes got which question. I'm sure there is a program or website that would improve on this model and I'll have to look for it before next year.
In the end the competition did what I needed it to do: engage the students in some fun physics exploration until the end of the school year. I think my students enjoyed it, especially since they didn't have homework, but it could use some improvements. For one, I don't think it did as good of a job helping them to review for their final exam. Their final exam scores were lower than I would have like, especially since for many it was their only "real" final exam after earlier AP finals. I expected the activities to keep them thinking about the content, which to an extent they did, but it did not help with remembering the finer details and tougher problems they needed to review. Many thought they still knew the material well enough not to have to study, a problem unrelated to the competition.
The points for several groups in each class were quite close, the winners only being a point or half a point ahead of the rest. It was nice to see though that different groups won different competitions. A few groups won twice over the course of the competition (thus earning bonus points) but it was not necessary to be the winner in each class. I would want to tighten up the system of awarding points, try to find activities that require more content knowledge for this semester and increase the difficulty of some of the activities. It wasn't bad for a first run but I anticipate the PhysX-Games of 2019 will be much better.
You know it's a bad situation when the hashtag basically writes itself.
This first year of teaching AP Physics C: Mechanics and Electricity & Magnetism has had lots of lessons, one of which I was not expecting. I assumed (and you know the old saying about assuming anything) that students in AP Calculus or Multi-Variable Calculus could graph data. And I was wrong.
Well to clarify, they can graph but they often choose not to. Be it innate teenage laziness, prioritizing their overwhelming workload, or even just forgetfulness, my students don't spend the time on their lab graphs that I would expect. My expectations were laid out at the beginning of the year, as they were in regular Physics and I'm sure every science class they have ever taken. They are summarized below:
1. All plotted graphs (not sketches) should be at least a half a page in size and made on graph paper.
2. Axis and best fit lines should be made with a ruler.
3. Each axis should be labeled with the quantity and units. Each axis should have a uniform scale but it need not be the same from one axis to the other.
4. The graph should have a descriptive title (i.e. not "Graph #3").
5. If multiple data sets are plotted use different colors and/or different data point symbols. Include a legend.
6. Add a best fit line or curve to your data that gets as close as possible to all of your data points. Do not "connect the dots." If the best fit relationship is linear include a slope triangle to calculate the slope of the line.
I don't feel that any of these requirements are too extreme, strict or beyond what they are being taught in math class. Yet as the year has progressed I have seen the graph quality decrease. The occasional student "forgets" to do it on graph paper; I may let it slide. Once in awhile someone makes the graph too small and I'll draw an unhappy face on it in red pen. The mistakes were becoming more common but due to drowning in curriculum development I kept ignoring the growing problem.
But then it became too big. Last week I collected student lab notebooks with two labs in it. One required several graph sketches (just a variable labeled axis and a general shape, no plotting) with two plotted graphs and the other only required two plotted graphs. Students had begged for additional time for lab notebooks and after agreeing I joked that I was expecting perfection.
I did not get it.
It started with one unbelievable graph. Bad enough that I snapped a picture and posted it on my Twitter feed. Then there was another. And another. I collected enough of the "worst" that I decided that I had to have a little "talk" with my classes about quality of work. I assembled them into a powerpoint and planned the reckoning.
The big day was today and I had it all set up to make the big points in an amusing way, but letting them know I was serious. I started each class with, "I graded your lab notebooks. We need to have a bit of a chat. What math level are you in again?"
Students warily reply "Calculus..." because they know they're getting set up.
"Oh that's right," I reply, "So you should be able to make a graph right?"
They nod.
"Well, I thought so too, but we need to talk about that."
In one class a student said, "Oh man, she made it into a powerpoint, that can't be good."
I assured students that these contributions were anonymous, and that if their graph was included I still care for them and I know that they can do well in Physics. They just had a big "oops" with this graph.
We proceeded to flip through the examples, with a mixture of roaring laughter (to the point of tears for some) and absolute disbelief.
They had questions:
"Someone turned that in?"
"Is that a hole in that paper?"
"What is that line even supposed to be doing?"
"Were these all from that one assignment?"
One student at the end said, "Wow, and we had extra time so you wanted them to be perfect." Yeah kid, I was shocked too.
In the end it was a funny way of reminding them of my expectation, and now I have a collection of some of the worst graphs I've ever seen. Of course I would rather not have had the situation at all but at least we can all benefit. The collection is available as a pdf and individually below. Feel free to use in your classroom for the same purpose, hopefully they help you avoid your own #GraphFails.
Only one data point really? No ruler used for the axis, not made on graph paper, no slope triangle and the best fit line doesn't even go through the single data point!
One of my students said that this apparent best fit line (that completely missed every data point) might be a Z-axis. I don't know if that makes it better. And no, seeing the grid through the back side of a blank piece of graph paper doesn't count.
Not on graph paper, not made using a ruler and made a thicker line (potentially to hide poor data). Actually I don't even know if these data points are even properly plotted. We decided this was more of an artistic representation of someone else's graph than a graph itself.
Students often ask to use Excel, and they can, as long as they can use it right. This is not right. I have no idea how that best fit line worked with that data.
These are supposed to be sketches, not plots, with a variable on each axis. That pen tip is for scale. Yes they are that small.
If you're asked to make a slope triangle on your graph it will probably be linear. When in doubt, the student apparently thought drawing a slope triangle would help anyway.
When I said a "uniform scale on each axis" I didn't think I need to be specific and say you need more than one number to establish a scale.
Of course having no scale is worse.
The large data points on this were annoying but not terrible. It was the sneaky breaking of the graph that they tried to slip past me.
When your data doesn't seem to have a trend, I guess plugging it into a calculator is one way of finding a best fit line.
Then again, even if the best fit line seems obvious maybe you should use your calculator to double check.
After a few year's dalliance with Energy before Momentum, I have switched back to Momentum before Energy. Please don't flame!
One benefit to the return is that our annual egg toss competition, Grass Omelette, has returned to late October/early November. And that increases the likelihood of nice weather.
We conduct the event prior to any discussion on impulse so that we can refer to it during or after our lessons on F∆t = m∆v.
I shoot the catches at 120 fps so that I can pull half-decent still images of "splashes" to give to the individual students who were brave enough to don the plastic ponchos and kilts. I'm currently using a Panasonic Lumix DMC-FZ200. Maybe in the future, I'll shoot normal-speed 4K video to get better stills. At some point, consumer high-speed 4K will be available. I know the Sony RX10 iv can shoot 24 fps at full resolution (as well as 960 fps lower-res high-speed).
In any case...
Egg Toss 2017 Catches
Egg Toss 2017 Splashes
When I had 5 sections of Physics (no AP anything and no Conceptual Physics) in 2013, I had enough to produce an amusing compendium set to Vangelis' Chariots of Fire.
As part of our NGSSification this year I've tried to put more demonstrations into the hands of students. Before the beginning of each unit I will look at the lectures of previous years and the list of demos I plan to do. If at all possible, I will make miniature versions of the demos that students can do in lab groups. These miniature versions don't usually take long but engage the students. We can then follow up with a few brief notes that explain what they have seen.
At the beginning of our light unit I wanted students to explore the relationship between wavelength and frequency in the electromagnetic spectrum. I made a chart of eight electromagnetic waves, places they are seen or used, a wavelength and frequency (pdf or google doc). I printed the information onto address labels (pdf) and put them on blank cards from RAFT. I passed out a card to each student and asked them to find the three other students that have cards about the same electromagnetic wave. Students were to find their group and then share their information so that they got the "whole picture" for that particular type of electromagnetic wave. I asked students to look at an image of the electromagnetic spectrum on my projector and a different one in their textbook. I thought that between the two images and four students they would be able to match the name to the example to the wavelength to the frequency. I was wrong. Quickly it became apparent they didn't see the connections I did.
Students were looking for the exact frequency on their card to be listed on either the image in their textbook or on the projector screen. Instead images of the electromagnetic spectrum show a range of frequencies for different types of waves. It is very common for sources to have different frequency ranges for the same wave type. This lead to lots of confusion and meant I had to go from one group to another to make sure that each student was sorted correctly.
In the future, I'll only show them one image, the one below. I added red dots representing each frequency and wavelength combination that I had put on the cards. I'll tell students that if they use the wavelength equation they will find someone with a card with the exact frequency they calculated. It was also not obvious to students that they needed to use this equation. I'm hoping this illustrates to students that their specific wavelength is part of a range of wavelengths for that type of wave.
After students were properly sorted I asked them to write the information about their wave onto a whiteboard to share. The whiteboards were held up and shared with the whole class. I helped students organize the information in a more familiar electromagnetic spectrum. To make sure they got the correct information it became more "Write down what I'm saying," and less "Write down what was written down by your peers." By the end of it I feel like they understood the relationship between frequency and wavelength but it was not the clearest way for them to get the information. I don't know if I will continue this activity the same way again.
The second day I wrote an activity I called Light Phenomenon Lab (google doc or pdf with more teacher information) made of eight different demos I used to show as part of a lecture. Each group was given brief instructions about how to create the phenomenon to observe and given some time to play. There were great exclaims of "Oh cool!" and disbelief as students explored and shared their phenomenon from group to group. Some groups were asked to read a page or two out of their textbook that explained the higher level concepts.
Each group was instructed to make a whiteboard with the title of their phenomenon, what they observed, how it worked, etc. Each group had been asked a question that required them to apply what they had seen to a new situation. This question was to be answered on their whiteboard as well. Below are examples from my three classes:
Each student copied down the phenomenon name and the answer to the question posed after each group shared their board. This was much more successful than the previous day. Students took ownership of being the "experts" on their phenomenon and enjoyed wow-ing the rest of the class by showing it off. It lead to more questions, "playing" with the equipment to find out what they could discover. I was able to create a make-up lab (pdf or google doc) for students using YouTube videos of similar phenomenon.
On both days, students were hands-on with something or moving around. We still discussed a few things and I asked them to record some things in their notebook. One I would consider a #fail (or in need of some tweaking) but the phenomenon day I would definitely consider a success. Students still got the important elements of the "lecture" but it was much more engaging.
Soon I'll post more about NGSS Phenomenons ... after Finals Week.
I developed an activity using force sensors to create a visual representation of Newton's Third Law.
The activity includes a brief exploration of the force sensor, then engages students within lab groups to conduct miniature tug-of-war sessions using the force while the computer records force vs. time data to plot a real-time graph.
The symmetry of the plots revels that whenever one object exerts a force on a second object, the second exerts a force on the first that is equal in magnitude and opposite in direction.
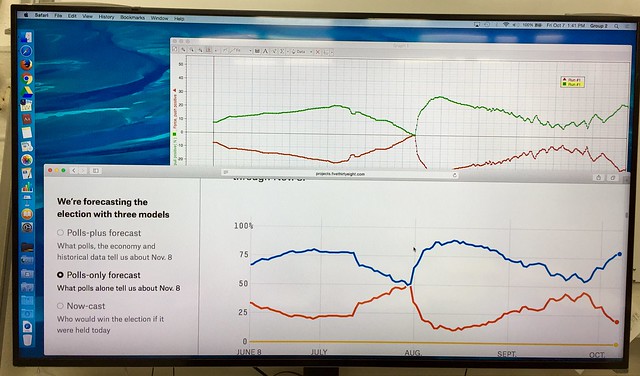
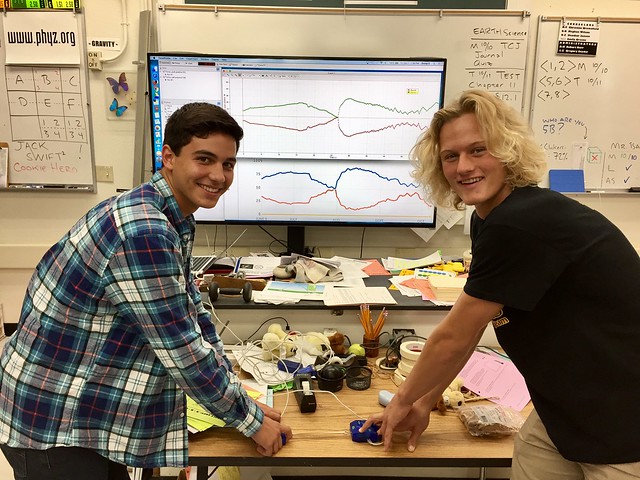
The plot also resembles the "probability of winning" graphs produced by Nate Silver's FiveThirtyEight team.
So I challenged early finishers of the lab to try their hands (literally) at reproducing the Presidential graph using force sensors. I thought the students did a fine job of it.
Here's the student sheet for the activity. It's adapted from the one included in the Conceptual Physics lab manual authored by Paul Hewitt and me.
I use my Arbor Scientific Air-Powered Projectile rocket every year. With my Conceptual Physics students we take the data as a class, determine the average time and use that to calculate the maximum height. With my older Physics students this year I decided to open it up. I told students how the rocket worked and asked them to write their own procedure to find the maximum height and initial velocity. Not surprisingly, groups independently determined that the best way to
determine this information was to time the rocket's entire flight and
then use half that flight time to determine the rest. Once students determined how they were going to test it, we went out to an open space and launched the rocket five times with the "low" washer and five times with the "high" washer. Each group collected their own data for their calculations but then I collected their results for each period.
I noticed during three periods of trials that the rocket launched sooner later on in the day. In the morning the rocket consistently launched after 5 pumps with the "low" washer and 7-8 pumps with the "high" washer. By the afternoon it launched after barely 4 pumps with the "low" and 5-6 with the "high." It was a warm day so temperature definitely played a role. Looking at archived temperature data for our area it was about 82 degrees for the first period's data, 90 degrees for the second and 97 degrees for the third. If you look at the consolidated data for all three periods you can see that the maximum heights and initial velocities decrease as the day went on.
My last period did get a chance to try the "super" washer. Now I wish I had tried it in the morning for comparison when it was (relatively) colder.
There are lots and lots of things you can do with this rocket. There is an additional set of wood angled blocks for consistent angled shots you can purchase.
I decided this year that if I was going to continue to take the time to teach students how to interpret kinematics graphs of motion (displacement-time, velocity-time and acceleration-time graphs) I was going to bring them up more often during the year. As we transition in my class from basic kinematics equations to projectiles I was looking for a lab that did just that. This is where it pays to keep more resources than you currently use in your curriculum. I found a pdf I had downloaded from Vernier using motion detectors and a ball. The lab looked simple enough and I tried to reproduce the results myself.
The original instructions had called for a wire basket to be placed over the motion detector to protect it from the ball's return. I tried this with a tennis ball and found it very difficult to get the tennis ball to go up and down directly above the sensor. After lots of attempts (seriously like 50) I was able to get three sets of data to work with:
I wanted students to see what happened at the max height on both the displacement-time and velocity-time graphs and understand what it meant. I wanted them to identify the time that the ball was still being accelerated upwards by their hand (easier on the velocity-time graph by the way). I wanted students to see a constant slope of the velocity-time graph to remember that gravity is constant. I liked how it was coming out but still wanted to make sure that students had an easier time than I did with this lab.
After tweeting to @VernierST I was able to get a few suggestions that made it basically fool proof:
1. Instead of a small tennis ball use a larger basketball (more reflective surface for the sonar).
2. Instead of a wire basket, which I didn't have enough of anyway, try putting two books on either side of the sensor.
Since my books are shorter I had students put two books on either side of the sensor as it was facing up on the table-top (above a picture from their lab). Students got great results and were able to focus more on analyzing the graphs using the tools in LoggerPro. Below is a sample set with the points I asked students to mark in their lab. Overall the lab was actually pretty quick and reliable. I think I could even move up the timing of the lab in my unit as an introduction to gravity rather than a review. Here is the lab I used.