At this point, I think we all have our own favorite PhET sims. You might be able to start a fight among physics teachers by proclaiming your favorite is the best PhET sim of them all. But honestly, what's not to love about John Travoltage?
When we get to wave optics, we use the light module to develop interference pattern mathematics. As we begin the study of mechanical waves, we explore representations in the water wave and sound modules.
High Quiet Low Loud at Teachers Pay Teachers Originally developed for use with Pasco's Waveport DataStudio software, this activity has been redesigned around Wave Interference's sound module. This time, the manipulation of amplitude and frequency is accompanied with audio feedback. The sim's "Particle View" feature shows that matter doesn't move much even as a wave propagates across greater distances. Diving deeper, we notice that our sound waves appear to be moving through a solid in the sim.
Here's the latest Phyz playlist, an idea I got from fellow Phyz blogger, Dan Burns.
The topic this time is waves and sound.
Curiosities: An alphabetical listing is dominated by the Ws. A chronological listing is dominated by songs released in the past five years.
Left behind: The list would be longer if not for careful curation. Apple Music search results tagged with an E (explicit) are not included. We fire up the playlist (at an Office Space "reasonable volume") during lab activities. You do not want to fill your classroom with expletives, no matter how mellifluous the tones. Because that will be followed by a conversation with your principal that you really do not want to have.
In any case, on to the list. If I missed a gem, let me know in the comments. I like that the alpha list begins with "Catch a Wave" and ends with "Waving Goodbye".
The Waves and Sound Playlist of Phyz
SONG
ARTIST
YEAR
Catch a Wave
Beach Boys
1963
Don't Make Waves
Brand X
1979
Every Breaking Wave
U2
2014
I Like the Sound of That
Rascal Flatts
2014
Salt Water Sound
Zero 7
2002
Sound
Daniela Andrade
2016
Sound
James
1998
Sound & Color
Alabama Shakes
2016
The Sound
The 1975
2015
The Sound of Silence
Simon & Garfunkel
1966
Veering From the Wave
Jennifer Kimball
1998
Walking on Sunshine
Katrina & the Waves
1985
Warm Sound
Zero 7
2004
Wave (Instrumental)
Antônio Carlos Jobim
1967
Wave (English)
Sinatra & Jobim
1967
Wave (Portuguese)
João Gilberto
1977
Wave
Beck
2014
Wave
Brooke Butler
2017
Wave
Jvck James
2018
Wave
The Midnight
2018
Wave (feat. Kali Uchis)
Major Lazer
2015
Wave (feat. Masego)
Abir
2016
Wavelength
Van Morrison
1978
Wavelength
Lastings
2015
Waves
Mr. Probz
2014
Waves
Blondfire
2014
Waves
Dean Lewis
2016
Waving
The Bevis Frond
2016
Waving
Blackfield
2011
Waving
The Delilahs
1995
Waving
Jami Lula
2002
Waving
Rich Whiteley
2009
Waving
Tamas
2017
Waving
Tiny Desserts
2019
Waving Goodbye
Sia
2016
Click the "playlist" label below to see more Playlists of Phyz. As of this post, there are playlists up for Electricity and Magnetism.
UPDATE: Well, this is a rabbit hole you might enjoy: The New York Times made a Yanny/Laurel slider. Spend some time with it. It harbors surprises that intrigue. Perception is pliable.
It seems to be a matter of utmost international importance that I share this cogent audio demonstration involving the consumptive "Yanny vs. Laurel" debate.
YouTuber Dylan Bennett presents
1. The unaltered audio clip.
2. The clip with the high-frequencies masked.
3. The clip with the low-frequencies masked.
As we age and/or do damage to our ears, it's typically the high-frequency response that goes first, as I understand things.
Reports are that this is a machine voice tasked with pronouncing "Laurel". Many folks with high-frequency hearing loss seem delighted to hear "Laurel". Many with acute high-frequency hearing detect "Yanny" with no ambiguity. Some folks report hearing both or that what they hear changes from one to the other. ...Auditory Switzerland?
I hope this brings peace to the many for whom this polemic has harshed an extant calm.
When Honda produced a musical road in Lancaster, California a few years ago, I linked to their commercial and developed a lesson that included it. A Blog of Phyz post was duly posted.
The off-key result (and a bit of auto-tuning) bothered me. And I certainly didn't keep that a secret. I assumed it was an implementation error of some sort, and tried to invoke the notion that, "It's not that the dog sings well, it's that the dog sings at all!"
Creative science YouTube content creator, Tom Scott, did the legwork, er, wheel work to get to the bottom of this grooviness gone awry. It boils down to "centers" vs. "gaps". Take a look.
If you spend time distinguishing between random and systematic error, you'll want to add this to your curriculum there.
Scott refers to his source: Caltech's David Simmons-Duffin. Here's the well-crafted and thorough article posted at DavidSD.org way back in 2008. It really is well done, and he calls out Honda for auto-tuning the last two notes of the road, as did I. Spend some time and enjoy this post:
The ringmaster of the Flying Circus of Physics is at it again. This time, Jearl hops into brewery for a beer. Root beer, that is. A former student taps the top of Jearl's open bottle, and physics ensues. Take a look.
The description is: "Musician Kenichi Kanazawa creating sand art via vibrations on his special table. The coloured sand takes shape as the vibration frequencies fluctuate." Essentially Kanazawa has made a large Chladni plate that he is resonating. By using different color sand he gets some beautiful images. Using mallets of different sizes (perhaps different materials?) Kanazawa rubs the mallet along one edge of the table. You can hear the tone produced each time carry until he touches the table again. At some points the video cuts and you can see different shapes in the sand. I don't know if the cleared areas are in fact antinodes or if the sand was manipulated during the film cut. I was not able to find much on this artist so we may never know!
Chladni plates are a beautiful and dynamic example of resonance in two dimensions. Originally a bow was used (as seen in this Harvard demo video) to create two dimensional standing waves in a flat piece of metal in different shapes. More common now is to use a frequency driver to control the frequency of the standing wave. Here is a video that goes through a wide range of frequencies:
Whatever the method, you can demonstrate that higher frequencies produce shorter wavelengths and thus smaller patterns on the plates. You can talk about the fact that the pattern on the plate seems to abruptly change as a resonant frequency is reached. Ask students if the locations where salt gathers are nodes or antinodes of those standing waves. There is a lot to learn from something that is also mesmerizing to watch. If you're not super comfortable with the explanation yourself try showing your students this Physics Girl video that has a good explanation and information on the next steps in modern science.
I thought I'd seen everything about Chladni plates (including this music video they appear in) but then I learned of someone who can sing to a Chladni plate! Meara O'Reilly works at the Exploratorium museum of San Francisco and has enough voice control to sing to Chladni plates to create different patterns. Her website devoted to this phenomenon is here and an example is below. While amplified, this is produced by the human voice and not a frequency generator. It is amazing.
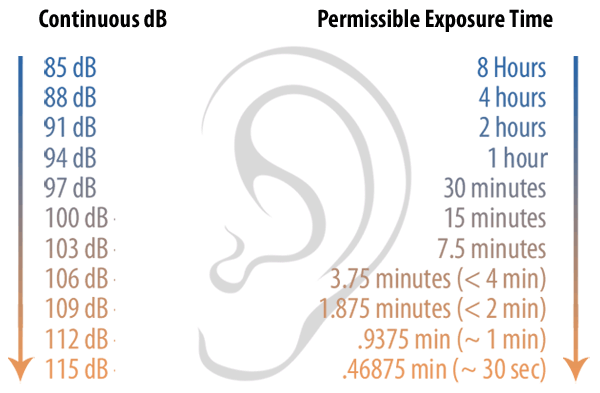
I tend to stand on a soap box during my sound unit and take the opportunity to talk about sound safety. [Other related Blog of Phyz posts: quiet fireworks and firework sound safety.] I discuss decibel scales and show students several graphics with common noises and their values. Some of my favorites are below:
But it is sometimes hard for students to understand all the principles at once. I want to discuss allowed time duration, compare sounds they can relate to, talk about decibel reducing measures, and more. I find myself flipping back and forth between graphics during lectures and still not getting it all together.
I found this infographic that details over 60 noises with their decibel level, marked OSHA standards and suggested exposure times. The graphic itself is too large to view all at once but I loved the format. Noises were divided up as occupational or non-occupational noises. I typed up all of the activities with their decibel levels into a word document and selected 40 that I thought provided a range of activities students would relate to. I created another document for printing with the sounds, and OSHA recommendations. I cut out each one, mounted them to thicker bright paper and we were ready to go.
In class I explained the decibel scale to students and showed them a few examples. Then I passed out one sound slip to each student and asked them to arrange themselves into order from 0 dB and up. After they were arranged students took turns reading their sound and decibel rating. As they were sounding off (*ba dum ching*) I added in the cards describing the sound level (i.e. "comfortable 50 dB" or "Extremely Loud 100 dB") and the cards with suggested exposure times.
Students were surprised to learn the average decibel level of several common noise. They were shocked to see how many of them were past OSHA recommendations like "ear damage can occur here," or "unprotected noise exposure not allowed past this level." It gave them a chance to see all my talking points at once and they got to get up and move.
Space was an issue as 35 students shoulder to shoulder take up some space. I tried in my classroom for students to stand across the front of the room but they ended up in a weird convex arc and couldn't see or hear everyone else. I tried outside as pictured above but being right next to the street (on the other side of that fence) made it even harder to hear. In the future I would have arranged them in a circle around the room so that they could see everyone else. I would also hand students either a pictures of or the actual sound reducing devices where they would be needed to reduce the noises to a safe level. For example, students at 100 decibels would hold your basic foam ear plugs to show that their 20 dB reduction rating could lower those noises to a safe 80 dB. All in all I like the activity and look forward to refining it in the future.
Next week I begin my Thermodynamics unit which includes discussing the 0th, 1st and 2nd Laws of Thermodynamics. When I teach the First Law of Thermodynamics, we discuss how it is basically a restatement of the Conservation of Energy. A favorite demo of this is to use large ball bearings that get slammed together on either side of paper. They are often called "colliding spheres" and are a really simple way to show the heat lost in even a simple collision. When you slam the spheres on either side of the paper a small hole is burned into the paper. When I demonstrate this to students I have a volunteer hold a piece of paper straight up vertically and slam the spheres on either side of them several times. It takes students a moment to realize that holes have been made in the paper and then they notice the smell. Only a few holes in the paper is enough to fill the surrounding area with the smell of burning paper. I talk about how hot the paper must have gotten to literally burn at the contact point and that the thermal energy comes from conserving the energy from the initial collision. Dean Baird uses this as an exhibit in his student run Exploratorio, called "Fire Clap."
Even though it seems obvious to me that the burned hole is an example of thermal energy I wanted to show students the collision as viewed through a thermal imaging camera. I tried looking online but I could not finding any such video. I don't own a FLIR camera (yet) but the Exploratorium Museum of San Francisco does! I was there today to help with a Teacher Institute workshop and headed down to the FLIR exhibit with a set of the colliding spheres. Some other teachers and I got some videos:
Our first attempt showed that there was in fact a bit of heat around where the holes were made. You can see the color change around the edge of the hole over time:
While rearranging for another take we noticed that our hands left residual heat lines on the paper so we drew on the paper that way for awhile. Physics teachers are easily distracted by cool stuff. We found that my fingers didn't work well and when everyone held their hands up we saw why. My fingertips showed up black (cold) while everyone else's were white, the same color as the rest of their hands, apparently I have cold hands.
In this video you can see the experiment take place on the right and the projected FLIR video is on the left. Again the holes produced have a bright white that eventually fades to the color of the paper.
At this point we remembered that we were making holes and therefore we could "see" the heat signatures of things behind the holes. We oriented the paper so that a dark color was behind it so that we did not have contrast behind it. A well timed museum visitor passed behind and we can see that the color changes:
Another experiment commonly done with the colliding spheres is to slam them on either side of a piece of foil. This Educational Innovations post explains both aspects of the experiment. When we tried the foil we found that there was no heat seen through the FLIR camera. We could not heat the foil like we did the paper and see the residual lines from our hands.
According to Zeke Kossover of the Exploratorium it is due to the low emissivity of the foil. This FLIR article explains it a bit but basically the foil is so good at reflecting radiation (visible light and heat) that the FLIR camera does not accurately show its temperature. In the picture above the black rectangle on the right and the two spheres in my hand appear black which translates "cold" through the FLIR camera. They are in fact both room temperature or warmer as they have been held for a moment.
So now I have video to show my students that confirms, in more ways than one that thermal energy is produced when the two spheres are slammed together. There's nothing quite as cool as seeing the heat ... *bad dum ching*.
Every year, for as long as I can remember, I've shown a clip from the British show Brainiacthat makes a giant pendulum mirroring the in-class bowling ball demo. My downloaded copy is grainy and pixelated so I decided to try and find a better version. I downloaded one Brainiac episode (Season 1, episode 3) with the intention of editing it down to the 4 minutes or so that I wanted. I ended up watching the whole 40 minute episode and editing out six clips to use in my classroom. Not too shabby for some fun TV time.
Conservation of Energy and a giant pendulum:
Well explained and stands alone well.
Oil Slip & Slide:
Even really slippery surfaces have a coefficient of friction that slows down moving objects. You could have students estimate it using the values given in the clip.
LN2 filled water bottle:
Quick example of pressure, boiling and of course liguid nitrogen.
Does a duck's quack echo?
Sometimes students just won't believe you unless they see it for themselves. Or in this case hear it.
Don't microwave a CD:
#ThingsThatShouldGoWithoutSaying
Playground G forces:
Brainiacs (the volunteers and staff that put on the science of the show) try to get the most G forces possible out of a playground merry-go-round. You could get more but they are limited by human power.
Iron in cereal:
This is an easy demo to do in the classroom but it does take some prep, the right cereal, etc. This is a super short clip that demonstrates it if you don't have the time.
Now I want to watch more of it. Besides the energy pendulum the only other clip I have seen prior to this was another all time favorite, "The Electric Fence." It is pretty much all the things you wish you could do in your classroom but couldn't:
Update: For an exhaustive video demo lesson on the Brainiacs: Electric Fence clip, see this old Blog of Phyz post:
I was so happy to see that baby Boomer Phelps, son of Olympian Michael Phelps, wearing hearing protection at the games this week. Since the announcer are drowned out while I'm watching at home I imagine the aquatic center is deafening. I've been looking but can't find decibel levels from this week's competition.