Once there, select your county, district, and school. Leave the test, group, and subgroup alone. Click the on-screen "View Report" button.
Physics results are at or near the bottom of the resulting report.
For additional amusement, start at the beginning and don't select a county. That will show you statewide results. Or pick a county but no district to see how things stand in your county.
You'll be able to access more meaningful results via Data Director, but I forget the steps. I recall only that there are too many, and few are intuitive.
To simplify matters, I usually refer to my score as "P% of N," where P is the sum of the school's advanced and proficient performance while N is the number of test-takers.
The school's physics enrollment was down last year, but those in the class performed at an admirable level.
2011: 70% of 84
2010: 66% of 135
2009: 61% of 107
2008: 57% of 124
2007: 51% of 167
Our "pass rate" is up while our physics enrollment is uneven and generally decreasing. I understand that our incoming Freshman class is unusually large, so there is hope for the future.
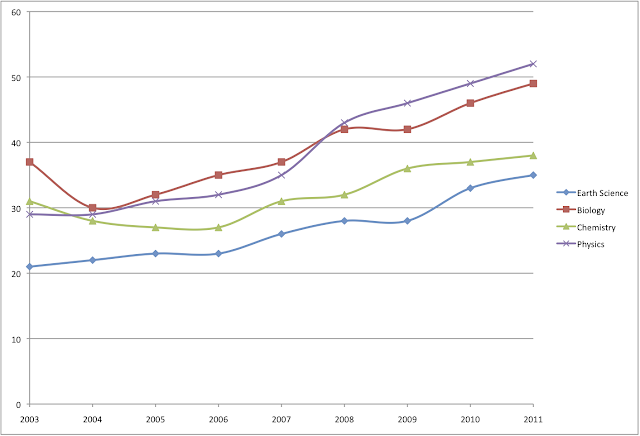
But what of the state? Physics continues to lead among the tested sciences.
76,144 students took the 2011 Physics CST
22% performed at the Advanced level
30% were Proficient
31% were Basic
9% were Below Basic
7% were Far Below Basic
The percent of Advanced and Proficient scores stands at 52%, up from last year's pack-leading 49%. The number of physics students earning Advanced or Proficient status has increased by 23% since 2003. No other subject-area test has seen anything close that kind of performance gain. Here's an obligatory Excel graph to show the story of the stats.

No comments:
Post a Comment